2025 Women in Business Trends
A look at women-owned small businesses in 2025
What Are Women-Owned Businesses Like in 2025?
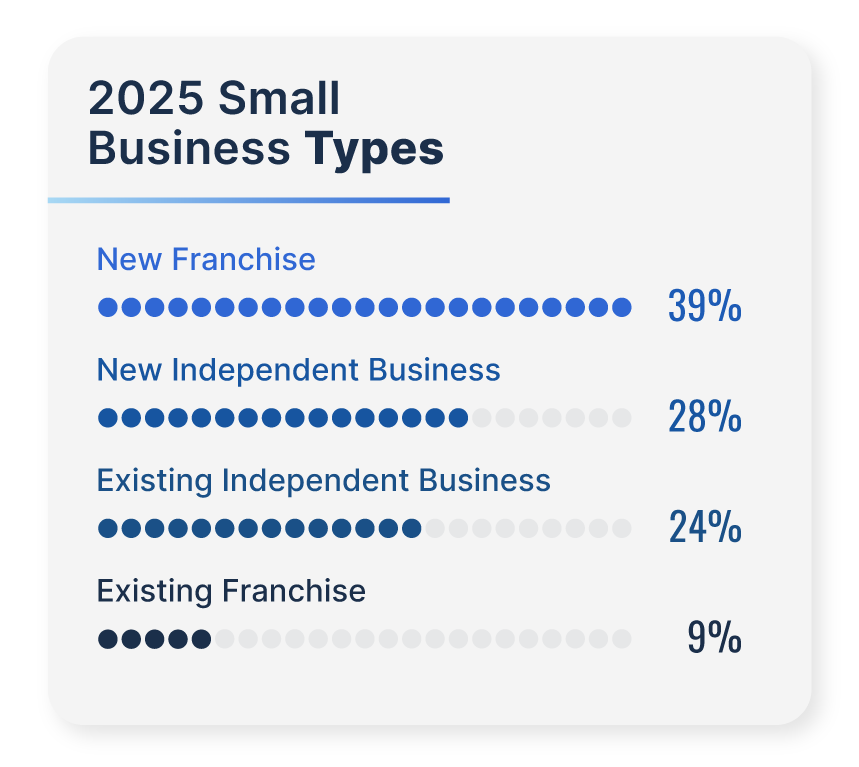
Business Types
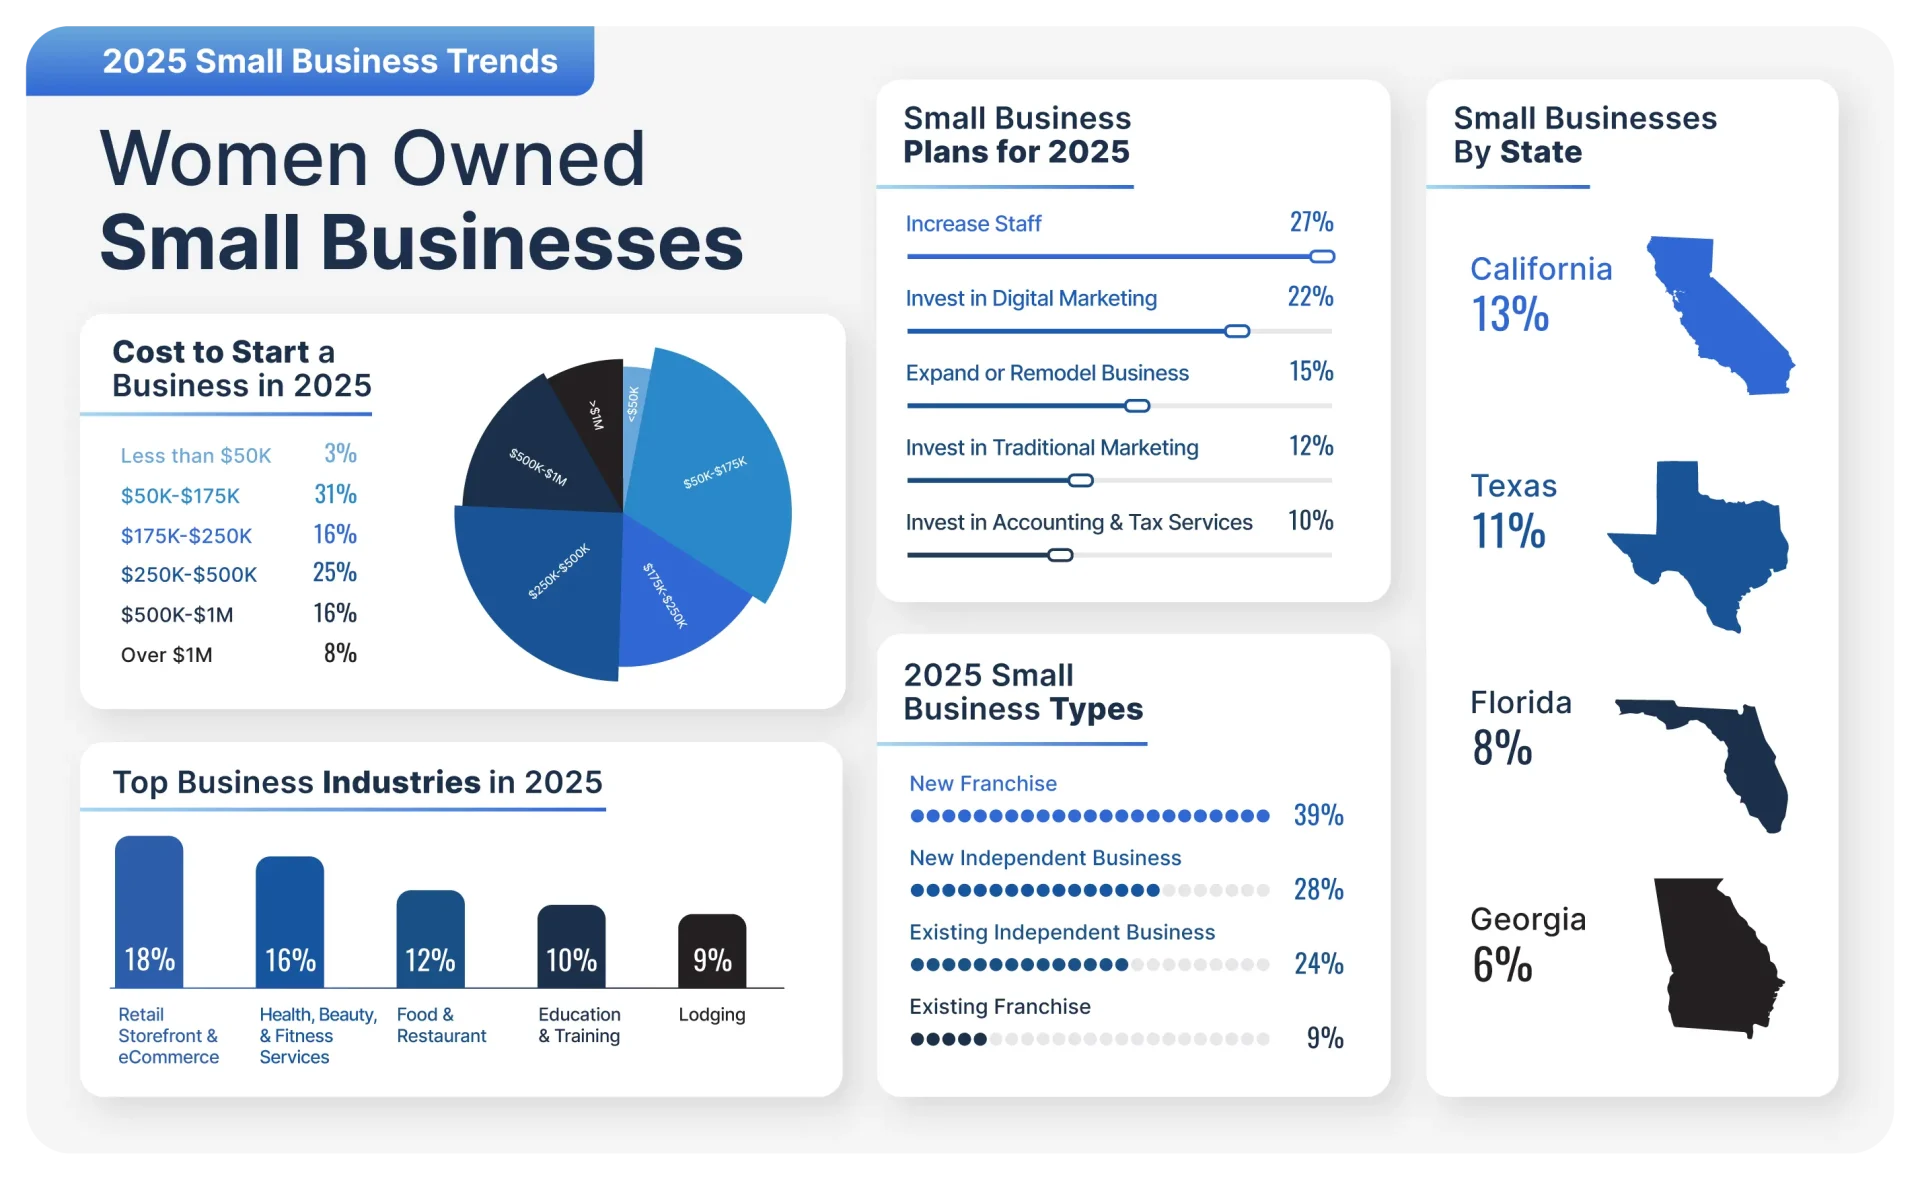
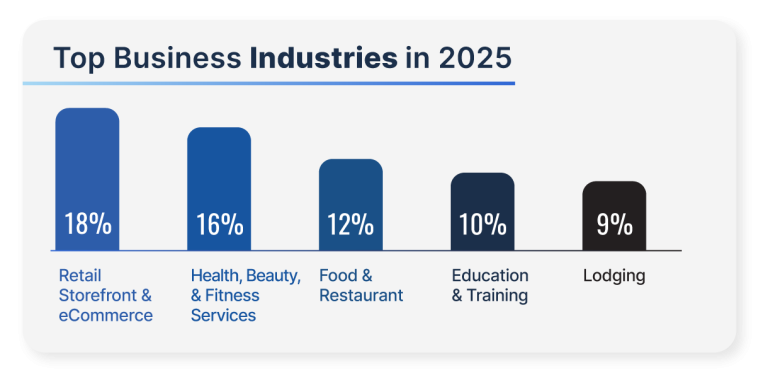
Top Industries
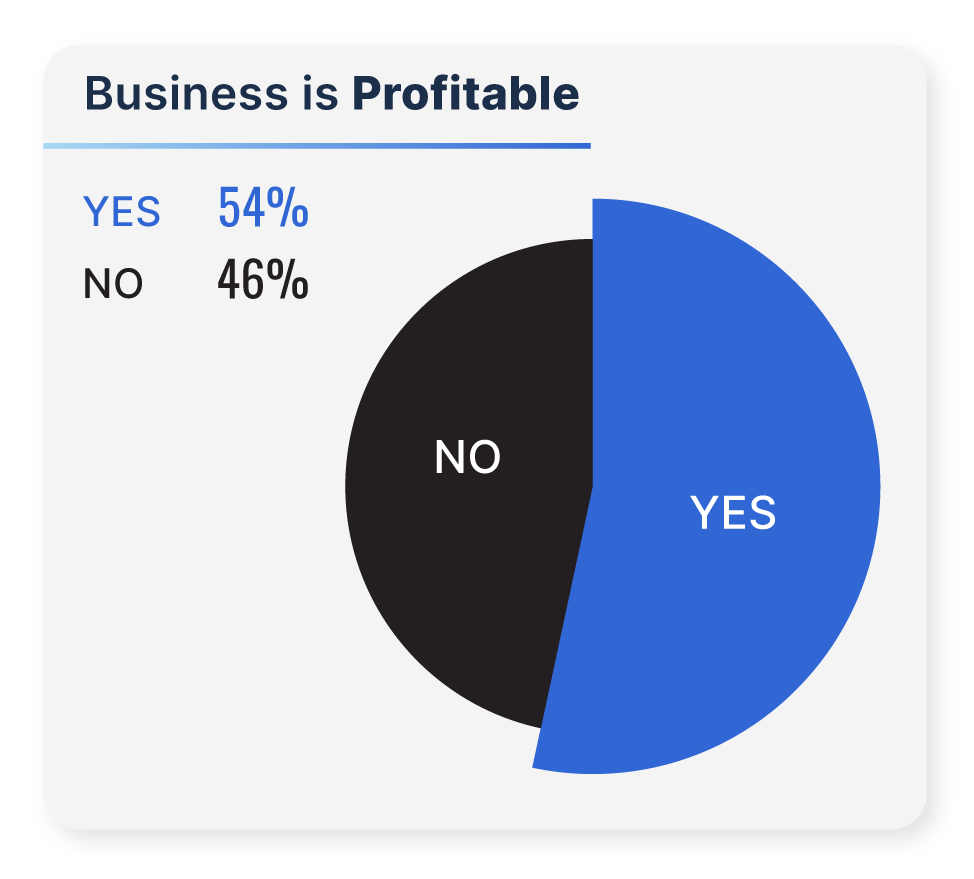
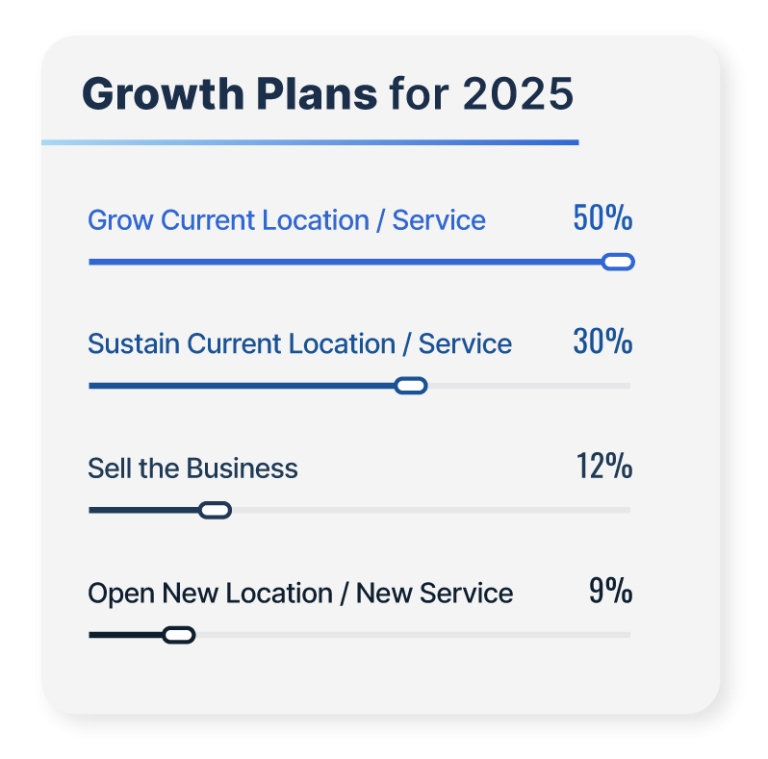
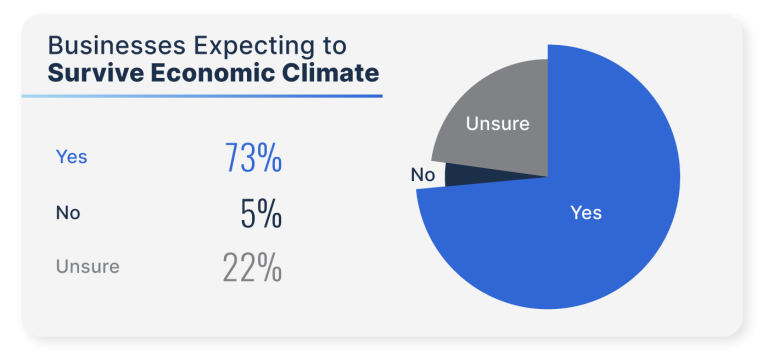
Profitability and Growth Plans
Hiring and Workforce Trends
Hiring trends indicate progress. Although 38 percent of women-owned businesses did not hire this year, those that did encountered fewer difficulties compared to previous years. Nine percent reported hiring was very difficult, while 15 percent said it was somewhat difficult – both figures represent a 27 percent decrease from the previous year.
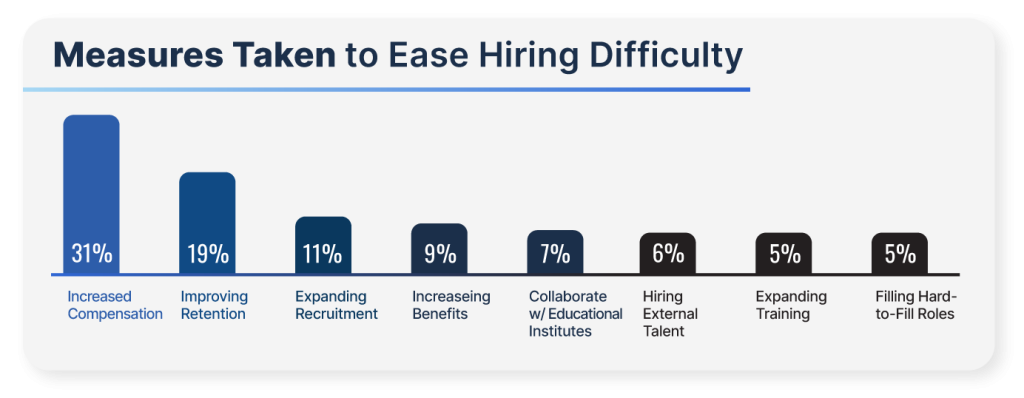
Most women-led businesses remain lean. Forty-two percent employ between two and five people, 22 percent operate as sole proprietors, and 16 percent maintain teams of six to ten. Among the hardest positions to fill were sales roles (29%), followed by food service (16%) and management (13%). The primary barriers include lack of experience (23%), poor soft skills (17%), and low applicant volume (14%).
In response, women business owners are taking action: 31 percent are increasing compensation, 19 percent are prioritizing employee retention strategies, and 11 percent are expanding recruitment efforts.
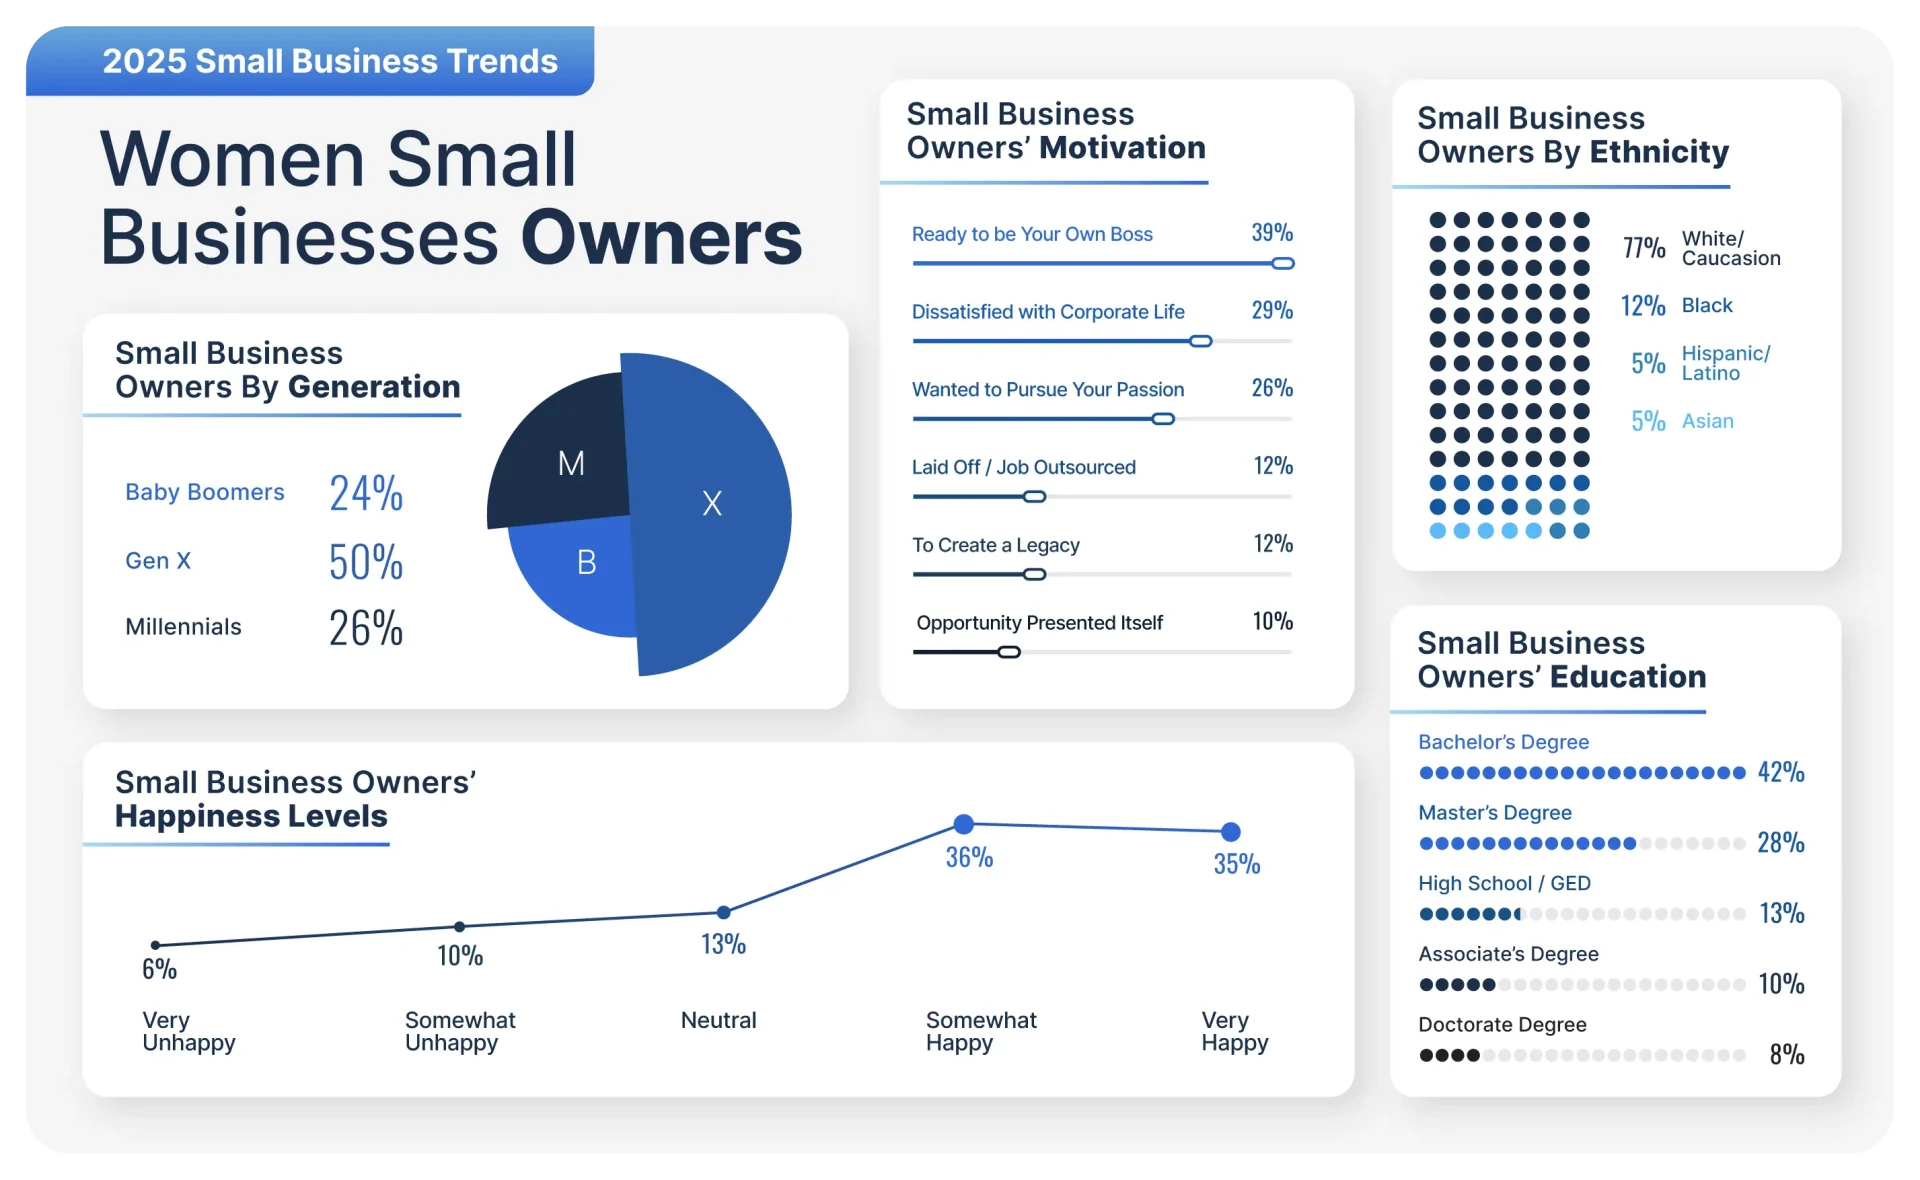
Who Are Women Business Owners in 2025?
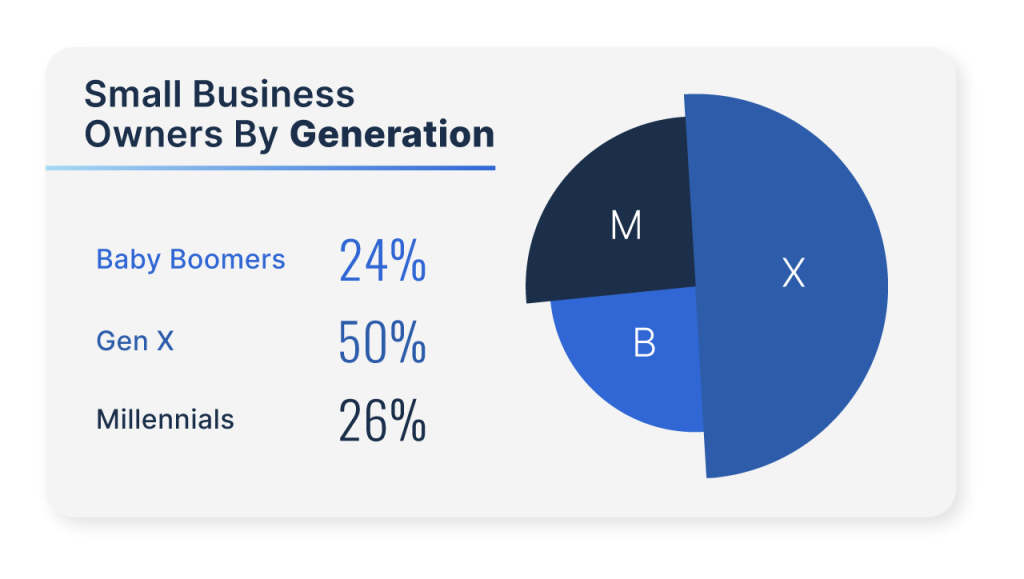
This year’s generational data shows a significant shift. Gen X continues to lead at 50 percent, but Millennials are gaining ground, now representing 26 percent of women business owners – a 34 percent increase over the previous year. Baby Boomers, by contrast, saw a decline in ownership, now comprising 24 percent of respondents. This trend reflects a gradual yet impactful generational transition in leadership.
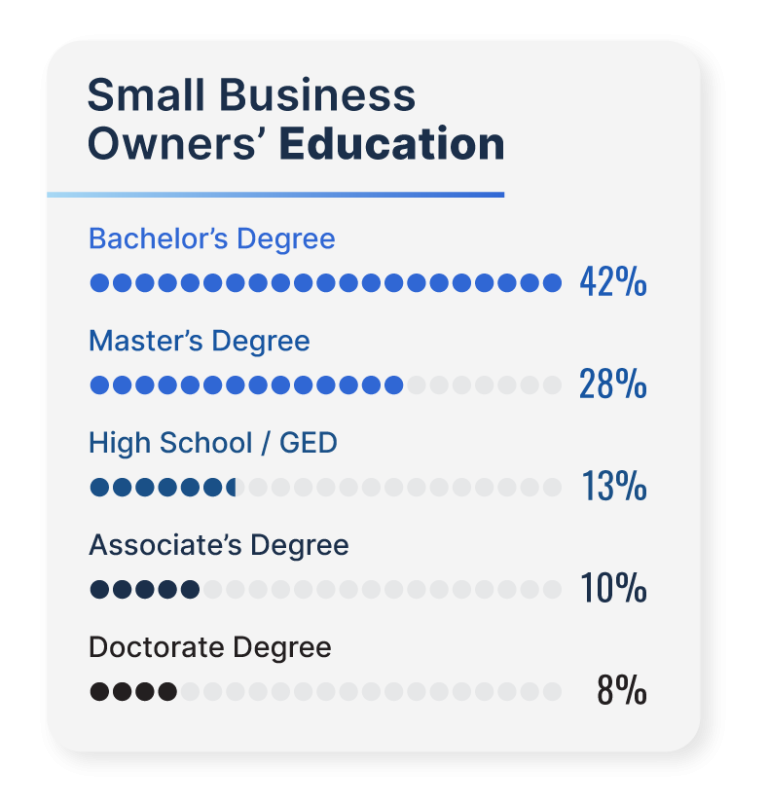
Educational attainment remains strong among women entrepreneurs. Forty-two percent hold a bachelor’s degree, 28 percent have earned a master’s, and 8 percent possess a doctorate. An additional 10 percent have an associate’s degree, and 13 percent completed high school or earned a GED. In total, over 70 percent of respondents have a college degree or higher, showcasing the high level of academic achievement within the community.
Diversity in Ownership
Women continue to represent 25 percent of small business owners overall, a figure unchanged from last year. Racial and ethnic diversity within the community remains stable as well. White or Caucasian women make up 77 percent of respondents, followed by Black or African-American women at 12 percent. Hispanic or Latina women and Asian or Asian-American women each account for 5 percent of ownership.
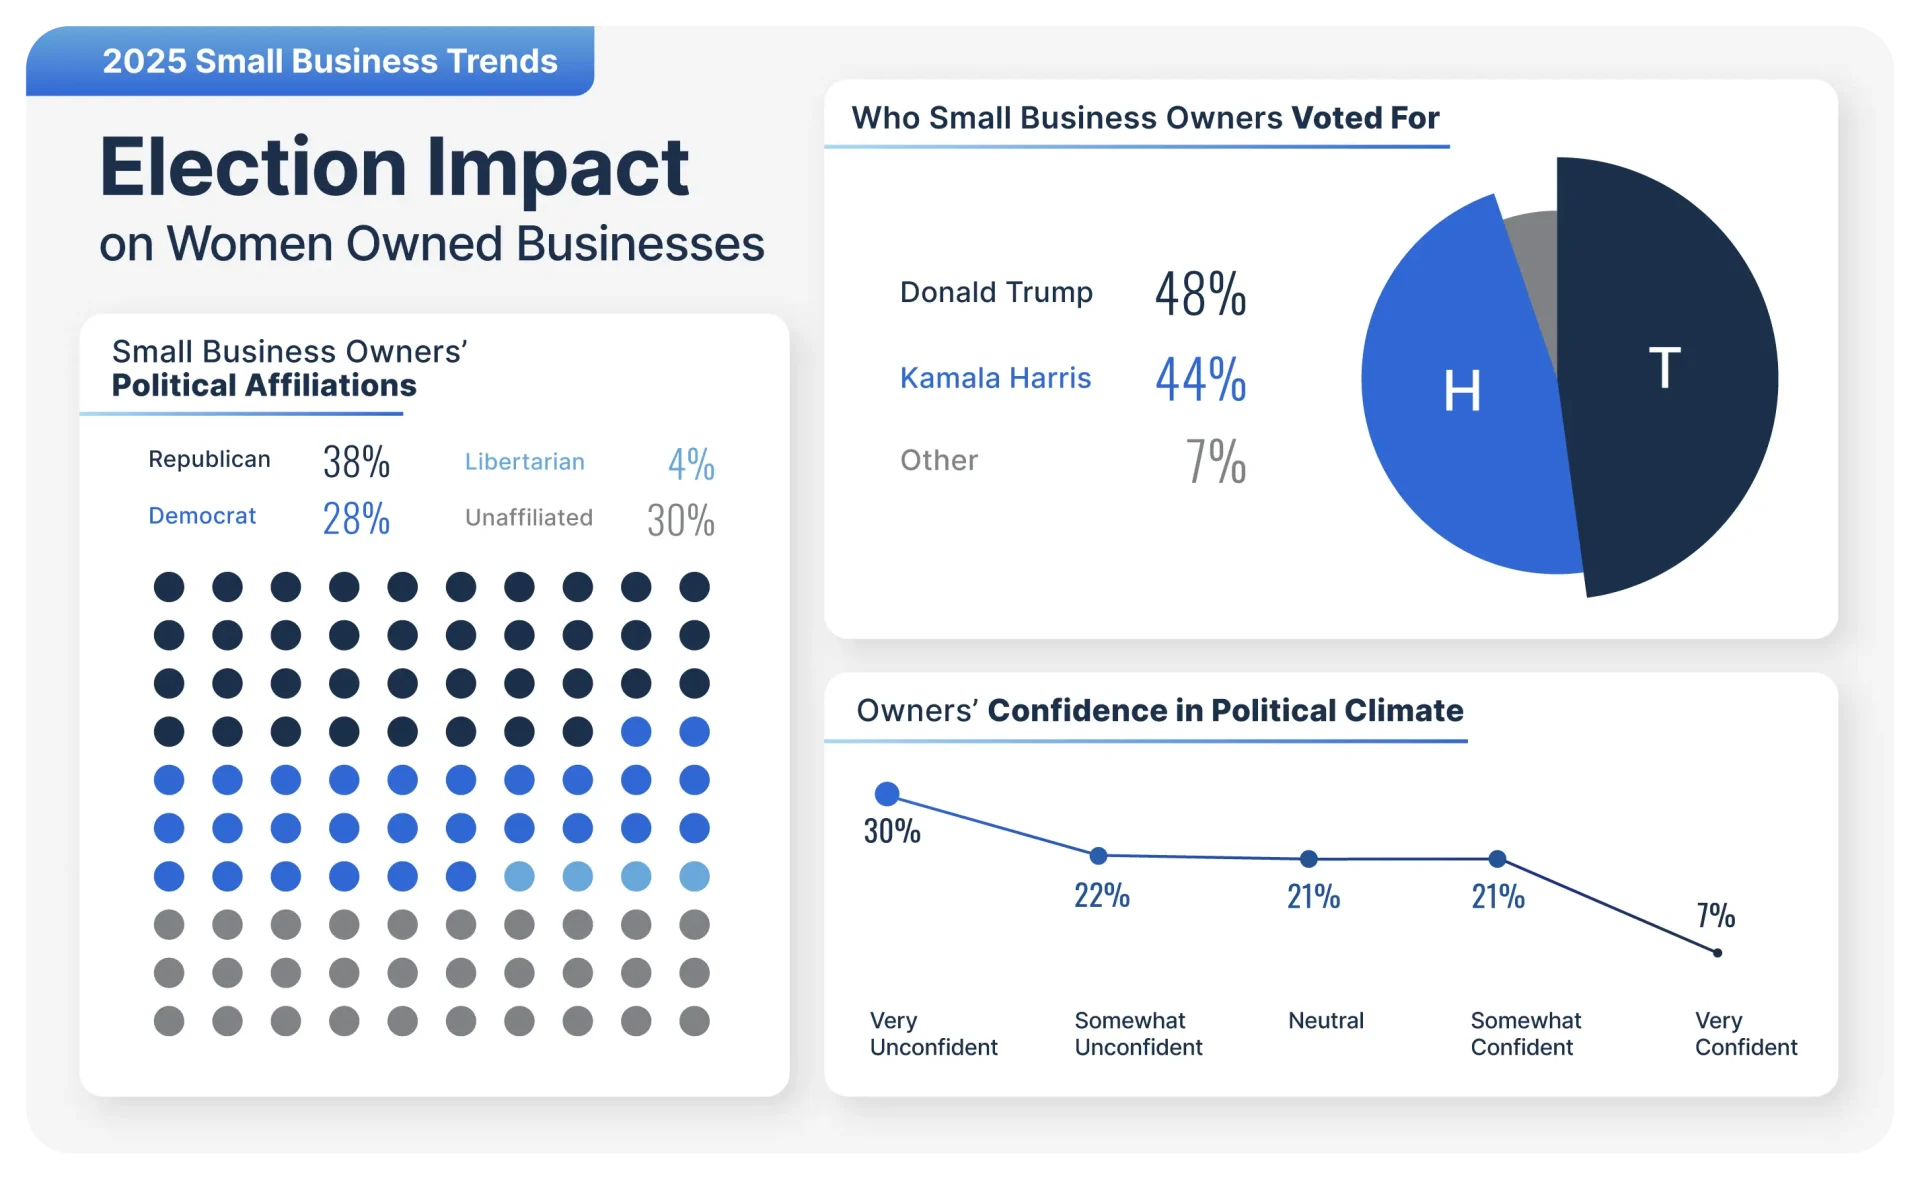
Politics in a Divided Climate
The political landscape among women business owners experienced notable shifts in 2025. Republican affiliation declined to 38 percent (down 7 percent), while Democratic identification rose to 28 percent (a 20 percent increase). Thirty percent of respondents reported no party affiliation, and 5 percent identified as Libertarian.
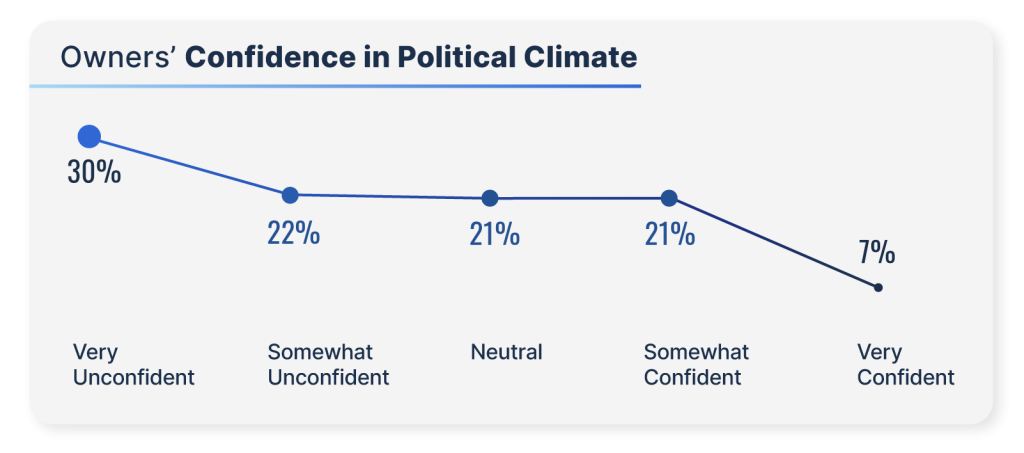
When asked about presidential voting preferences, 48 percent of women business owners supported Donald Trump, 44 percent backed Kamala Harris, and 7 percent selected another candidate or declined to specify. Confidence in the political climate became more polarized: 30 percent reported being very unconfident, while 7 percent expressed being very confident. The number of respondents expressing neutral or somewhat confident sentiments declined noticeably.
Backed, Building, and Betting on the Future
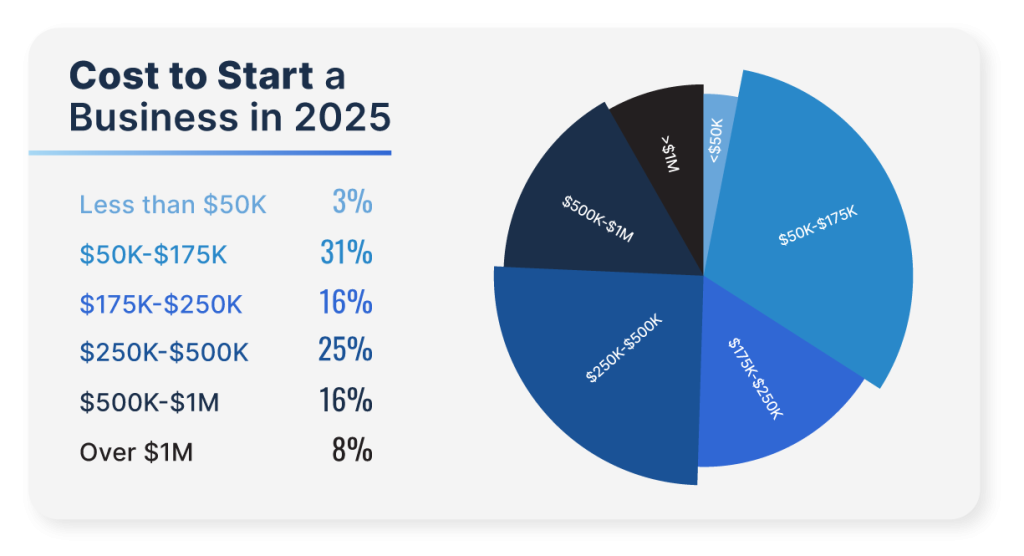
Startup costs vary widely, with 20 percent investing between $100,000 and $175,000, 16 percent spending between $175,000 and $250,000, and another 16 percent reporting costs between $500,000 and $1 million. Thirteen percent spent between $250,000 and $375,000.
To get their businesses off the ground, many women relied on professional guidance: 26 percent cited an attorney as the most helpful resource, followed by brokers or consultants (20%), CPAs (17%), and finance professionals (15%).
Study Summary
Trending


Your new life is right around the corner.
Together, we can get your business off the ground — no matter where you are in the small business process.